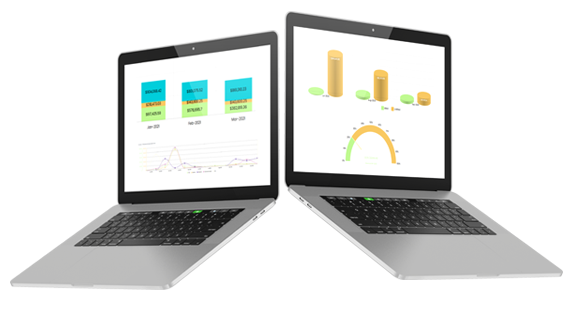
Make Better Business Decisions, Faster.
Our out-of-the-box reports and graphs gather real-time information you need in real-time and make it available across your entire organization relative to the functional area.


Our out-of-the-box reports and graphs gather real-time information you need in real-time and make it available across your entire organization relative to the functional area.


Charts, graphs and tabular reports for each module (Recruitment, Finance, Project Management) to quickly analyze key data and make the best possible business decisions.
You can quickly get a picture of how profitable a job will be while you’re creating, and then see how much you made after the job has been completed.
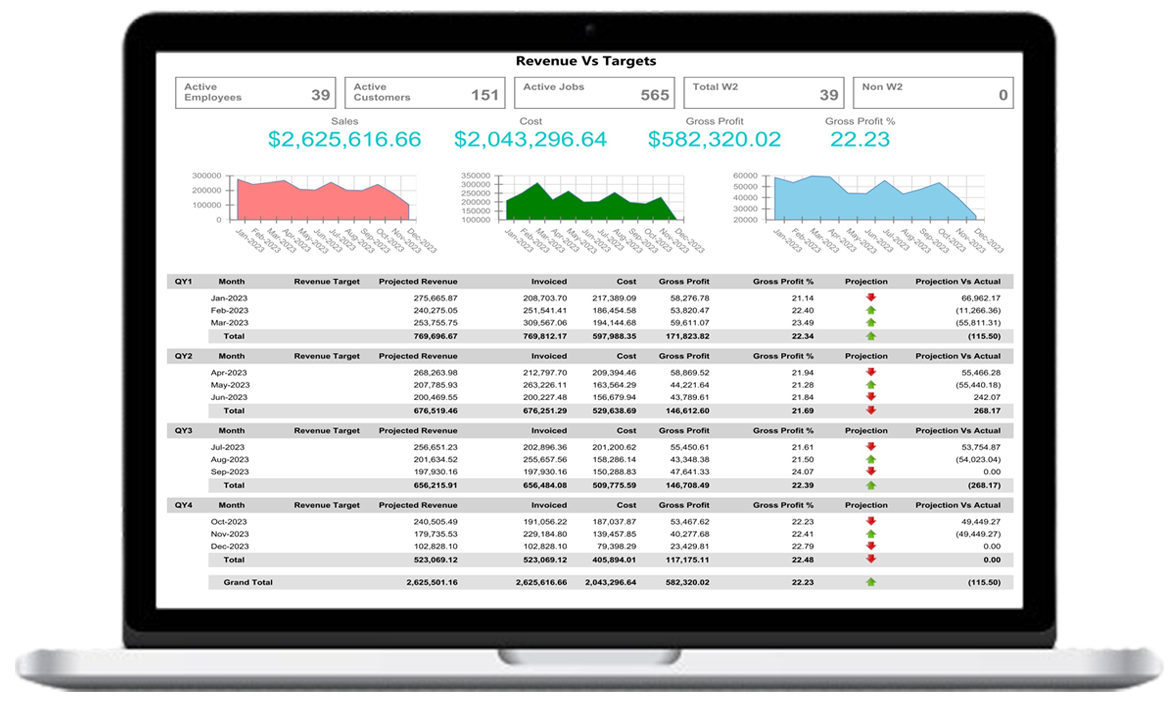
At-a-Glance Metrics Report showing GP per hour, sales, total hours, and gross profit for each month or week over a 12-month period so you can compare performance.
Download and Share reports across teams, offices, and regions so the entire organization has access to critical business insights.
Review Job or employee activities and performance over time along with historical margin trends.
We will work with you to custom report a new chart or report.

We love ProWizard and how swiftly we can get things done while using the software.
We truly value our partnership and are always impressed by your quick assistance. Your customer service consistently exceeds expectations.
We really appreciate the all-in-one solution that ProWizard offers—from CRM to payroll transfer, plus the flexibility of customized forms for onboarding.